
After the recent turbulent years of mass resignations, quiet quitting, and ultra-competitive job markets, organizations are starting to recognize the importance of people data and analytics.
Successful businesses use people data to analyze business performance and define goals. HR metrics are one of the key methods to do this. HR is, after all, an integral part of a company’s success.

One of HR’s many functions is to act as an organization’s eyes, looking both internally and externally for information and comparisons that are useful to better a business.
HR metrics are like an essential pair of glasses – without them, workplace data is visible but unintelligible. With the right lenses, these metrics bring patterns, trends, and discrepancies into sharp focus, enabling organizations to make informed decisions with a clearer view of reality.
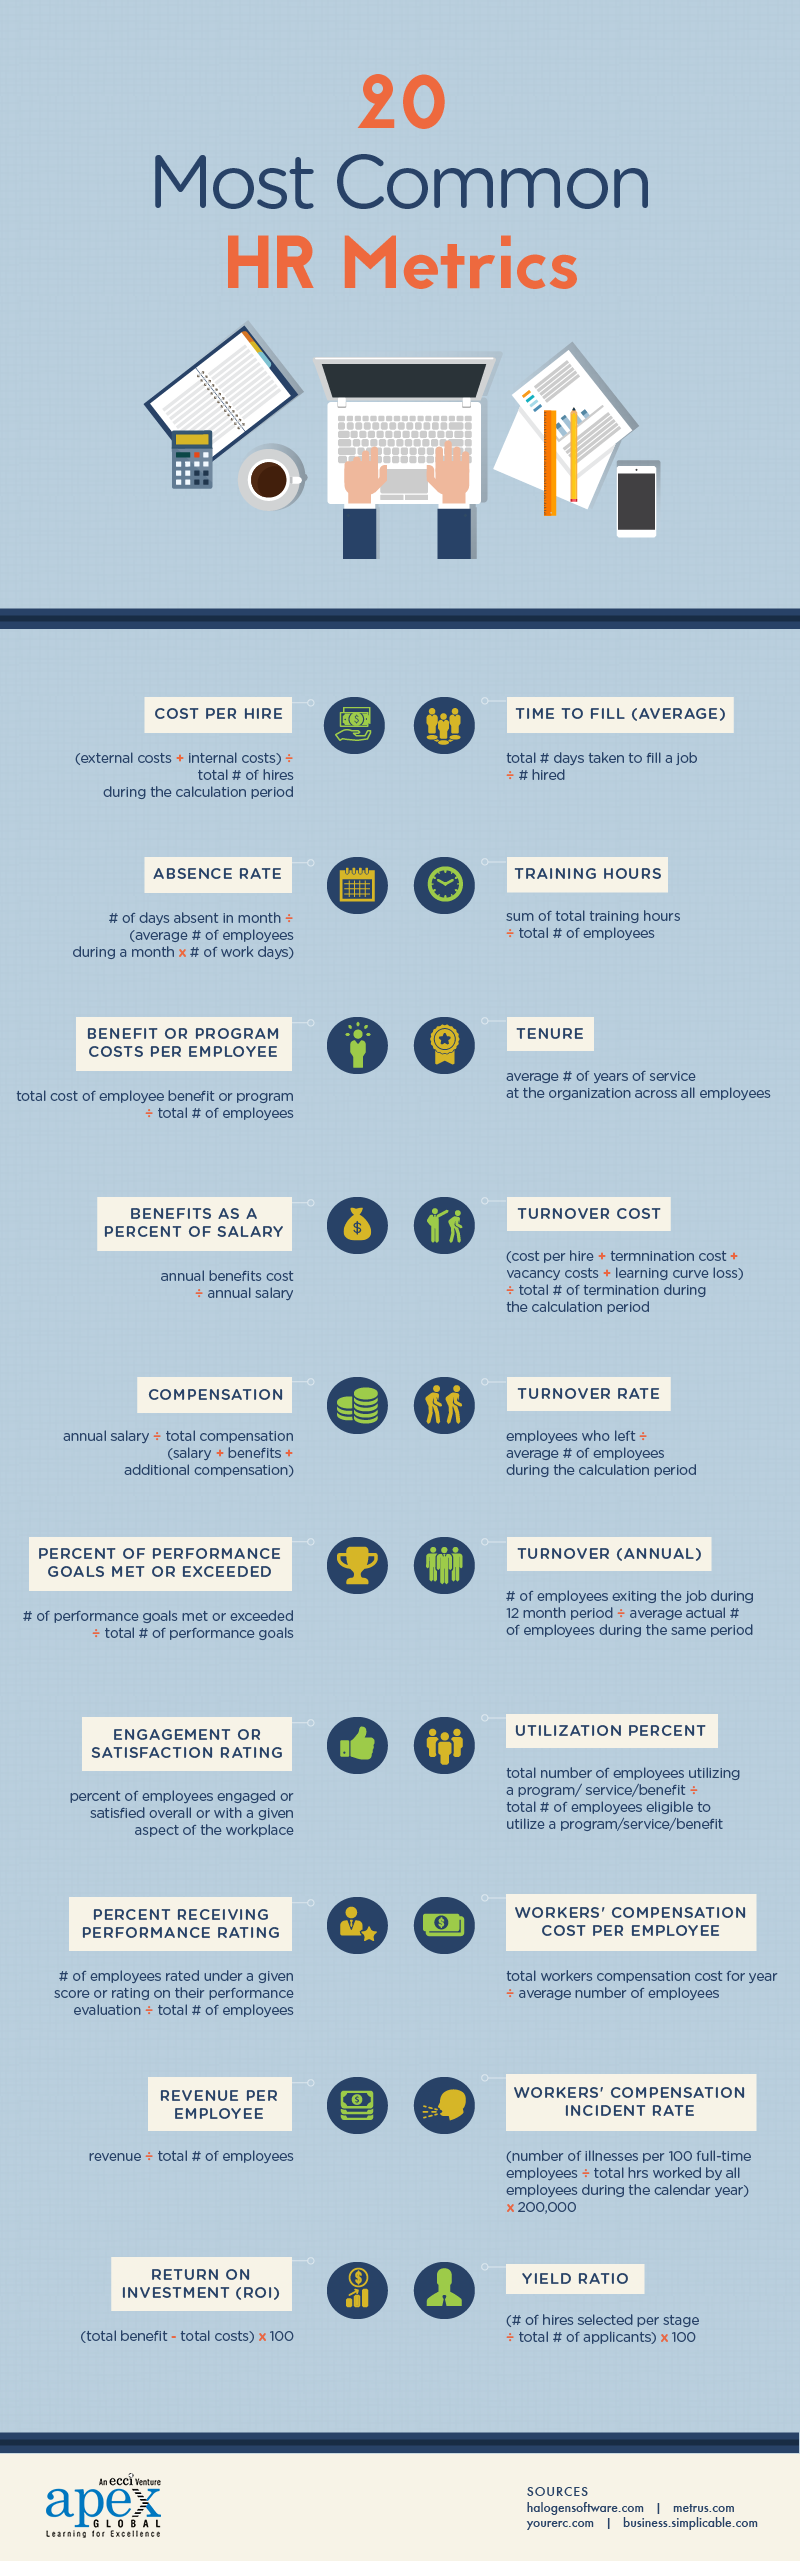
In this article, we will look at the 20 most common HR metrics businesses track to gain strategic insights into HR trends, costs, efficiencies, productivity, and success. So, without further ado, let’s dive in!
What you'll find in this article
- 1 1. Cost per hire
- 2 2. Time to fill (Average)
- 3 3. Absence rate
- 4 4. Training hours
- 5 5. Benefit or program costs per employee
- 6 6. Tenure
- 7 7. Benefits as a percent of salary
- 8 8. Turnover cost
- 9 9. Compa-ratio
- 10 10. Turnover rate
- 11 11. Turnover (Annual)
- 12 12. Percent of performance goals met or exceeded
- 13 13. Engagement or satisfaction rating
- 14 14. Utilization percent
- 15 15. Percent receiving performance rating
- 16 16. Workers’ compensation cost per employee
- 17 17. Revenue per employee
- 18 18. Workers’ compensation incident rate
- 19 19. Return on investment (ROI)
- 20 20. Yield ratio
- 21 Conclusion
1. Cost per hire
Cost per hire (CPH) is calculated to find out how much a company spends on average to acquire a new employee. This metric helps HR teams assess the financial efficiency of their recruiting process. This includes costs associated with advertising, recruiter fees, interviews, background checks, and onboarding. This metric is essential for budgeting and identifying opportunities to optimize the hiring process.
You can calculate CPH by adding up both internal and external hiring costs and then dividing that total by the number of employees you hired in a given period/total number of hires.
CPH = Total cost of hiring ÷ Number of new hires
2. Time to fill (Average)
Time to fill is the amount of time it takes to fill an open position. This is another key metric that gives insights into the efficiency of the recruitment process. A long time to fill can indicate potential inefficiencies in the recruitment process, a highly competitive job market, or challenges in attracting qualified candidates for specific roles.
To calculate the average time to fill, you just need to determine the total number of workdays it has taken you to fill the open positions in a given period (such as a year), then divide this number by the total number of roles or hires or positions filled.
Time to fill (Average) = Total days taken to fill open positions ÷ Number of roles or hires
3. Absence rate
Absence rate is the percentage of time that your employees are absent from work in a given time period. This includes days that an employee calls out of work at the last minute, is several hours late, or doesn’t show up at all. It doesn’t include planned time off, such as holidays or vacation days. While some time off is normal due to stress or illness, regular unexcused absences can reflect an issue.
To calculate the absence rate of your employees for a particular month, you can use the following formula:
Absence rate = (Total no. of days absent in a month) ÷ (Average no. of employees during a month x Total number of workdays)
4. Training hours
Training Hours is the average number of hours spent by a company on training each employee. It’s important to track these hours because, during the training period, employees don’t generate value for the company, so it helps managers to understand if their training programs are effective.
To calculate the training hours per employee, divide the number of hours existing employees (does not include new employees) spend training divided by the number of employees undergoing training over the same period of time.
Training hours per employee = Sum of total training hours ÷ Total no. of employees
5. Benefit or program costs per employee
Benefit or program costs per employee is a critical financial HR metric that evaluates your company’s average investment in each employee’s benefits. It aids in budget management, and by analyzing this data, businesses can optimize their benefits strategy and ensure they are offering competitive packages to their employees.
To calculate the benefit or program costs per employee, you can use the following formula:
Benefit or program costs per employee = Total cost of employee program or benefit ÷ Total number of employees
6. Tenure
Tenure refers to the total amount of time an employee has worked for a company or the average amount of time that all employees have worked there. Short tenure can signal the need to evaluate employee satisfaction initiatives, and long tenure can indicate the need to implement employee succession plans.
To calculate the average tenure per employee, you need to add up the amount of time all workers have been employed in your company and divide it by the total number of employees in your company. The formula would look like this:
Average tenure per employee = Total years of service of all employees ÷ Number of employees
7. Benefits as a percent of salary
Benefits as a percent of salary is calculated for understanding the proportion of employee benefits costs relative to their base salary. This key HR metric provides insights into the sustainability and competitiveness of an organization’s benefits offerings, enabling businesses to stay attractive to current and potential employees.
It is calculated by dividing the total cost of employee benefits for a specific period by the annual base salary of an employee for the same period. Then multiply the result by 100 if you want to get it as a percentage.
Benefits as a percent of salary = (Total benefits cost ÷ Annual salary) x 100
8. Turnover cost
Turnover costs are the expenses associated with replacing an employee, which helps show the cost impact of attrition. These include indirect costs like decreased productivity from the team absorbing extra work and the time spent by managers in hiring and training new employees. This data is essential in helping companies plan for and minimize these costs through effective retention strategies.
The average cost of turnover per employee can be calculated by adding up the cost per hire, termination costs (severance pay, unused paid time off & other costs), vacancy costs (costs incurred during the period when a position is vacant, such as costs of temporary staff, overtime, or reduced productivity) and learning curve loss (cost associated with a new employee ramping up & learning the ropes) and dividing this result by the total number of terminations during the calculation period.
Average cost of turnover per employee = (Cost per hire + Termination cost + Vacancy costs + Learning curve loss) ÷ Total number of terminations during the calculation period
9. Compa-ratio
Are the salaries of your employees competitive? Are they paid fairly? The answer to these questions can be found in compensation ratios or compa-ratios. This metric assesses the competitiveness of an employee’s compensation relative to the midpoint of a predetermined salary range. It is used by companies to ensure that employee compensation aligns with market and industry standards, ultimately enhancing their ability to attract top talent, reduce turnover, manage payroll expenses, and comply with fair pay policies.
To calculate the compa-ratio for an employee, simply divide the employee’s annual salary by the median salary for similar positions and multiply the result by 100 to get it as a percentage.
Compa-ratio = (Actual Salary ÷ Salary Midpoint) x 100
10. Turnover rate
Turnover rate reveals the percentage of employees who have left the company within a given time period (often a month or a year). A high turnover rate can indicate potential issues, such as poor candidate selection, ineffective management, low compensation, or a lack of advancement opportunities. Measuring and tracking turnover rate on a regular basis is critical as it directly impacts the company’s bottom line due to the high costs of recruiting and training new employees.
Turnover rate can be calculated by dividing the number of departures by the number of employees at the outset of the time period in question and multiplying the result by 100 to reach a percentage.
Turnover Rate = (Employees who left ÷ Average number of employees during the calculation period) x 100
You can use this formula to calculate the turnover rate for any period of time, like a year, a month, or even a week.

11. Turnover (Annual)
Annual turnover rate reveals the percentage of employees who have left the company within a year. It includes those who leave voluntarily and involuntarily. HR teams use this metric to gauge employee satisfaction and shape strategies for training and retention.
To determine the annual turnover rate for your company, divide the number of employees who leave your organization within a year by the average number of total employees (then multiply the result by 100 to get it as a percentage)
Turnover (Annual) = No. of employees exiting the job during 12 month period ÷ Average actual no. of employees during the same period
12. Percent of performance goals met or exceeded
Are employees meeting performance goals and objectives? If this number is high, then great! If it is not, then you have to drill into the story behind the numbers to understand what may be hindering employees. It could be outdated technology, bad hires, inadequate communication, or a simple lack of motivation. This number will help business leaders work with HR to develop a plan to get performance numbers back on track.
To calculate this metric, take the number of performance goals met or exceeded and divide it by the total number of performance goals, then multiply the result by 100 to get it as a percentage.
Percent of performance goals met or exceeded = (No. of performance goals met or exceeded ÷ Total no. of performance goals) x 100
13. Engagement or satisfaction rating
This is a vital HR metric that gauges the level of employee engagement or satisfaction within an organization. Employee engagement and satisfaction tend to influence aspects such as employee productivity, making it essential for companies to measure and analyze this metric.
Employee surveys are one of the best ways to calculate this. Issue company-wide surveys to your employees and ask questions rated one to five about their workplace experiences, job satisfaction, and overall engagement. The results can be averaged to rate your company’s level of employee engagement.
14. Utilization percent
Utilization percent refers to the percentage of eligible employees actively participating in or using a particular benefit. It’s a key metric that helps employers assess the effectiveness of their benefits program. If a benefit has a low utilization rate, it might be a signal to reconsider its relevance or communicate its value more effectively.
To calculate utilization percent, divide the number of employees utilizing a specific benefit by the total number of employees eligible to utilize the benefit.
Utilization percent = Total no. of employees utilizing a benefit ÷ Total no. of employees eligible to utilize that benefit
15. Percent receiving performance rating
Percent receiving performance rating evaluates the distribution of performance ratings among employees within an organization. This metric helps HR professionals and management evaluate the effectiveness and fairness of their performance appraisal process. By examining the percentage of employees who receive different performance ratings, organizations can identify trends and ensure that evaluations accurately reflect individual contributions.
You can calculate this metric by using the following formula:
Percent receiving performance rating = No. of employees rated under a given score or rating on their performance evaluation ÷ Total no. of employees (to get it as a percentage, multiply this figure by 100)
16. Workers’ compensation cost per employee
Workers’ compensation cost per employee is a crucial financial metric that organizations use to evaluate the expenses associated with providing workers’ compensation insurance to their employees. This hr metric determines the average cost incurred by the organization for each employee over a specific period, typically a year.
It includes not only insurance premiums but also administrative expenses, legal fees, and any other expenses linked to managing workers’ compensation claims and coverage. By calculating this metric, businesses can assess the financial impact of workplace injuries & illnesses on a per-employee basis, aiding in budgeting, cost control, and overall risk management.
You can calculate this metric using the following formula:
Workers’ compensation cost per employee = Total employees’ compensation cost for a year ÷ Average number of employees
17. Revenue per employee
Revenue per employee is a financial metric that calculates the average profit each employee contributes. This metric allows companies to gauge the efficiency, productivity, and profitability of individual employees and the organization as a whole.
It is very easy to determine revenue per employee. Just divide your company’s total revenue for the year by the number of full-time employees that you have.
Revenue per employee = Total Revenue ÷ Total no. of employees
You can also calculate this metric for individual departments.
18. Workers’ compensation incident rate
Workers’ compensation incident rate determines the number of work-related injuries or illnesses within a specified period, typically per 100 full-time employees. Organizations use this metric to assess the safety of their work environment, track changes in incident rates over time, and identify areas where safety improvements are needed to reduce workplace injuries and illnesses.
Workers’ compensation incident rate can be computed by using the following formula:
Workers’ compensation incident rate = (No. of injuries and/or illnesses per 100 full-time employees ÷ Total hours worked by all employees during the calendar year) x 200,000
The 200,000 figure here denotes the total no. of hours worked by hundred full-time employees (working forty hours per week, fifty weeks per year). It also provides the standard base for calculating the incidence rate for an entire year.
19. Return on investment (ROI)
ROI is another crucial financial metric that evaluates the profitability or cost-effectiveness of an investment or initiative. It measures the gain or loss generated relative to the costs incurred and expresses this as a percentage. It can be applied to various initiatives or programs, such as an employee training program, a recruitment campaign, or an employee wellness program, to assess their financial impact.
To calculate the ROI, just subtract the total costs from the total benefits of a specific initiative or investment and then multiply the result by 100 to get it as a percentage.
ROI = (Total benefit – Total costs) x 100
20. Yield ratio
Yield ratio measures the percentage of applicants that make it to the next stage of the selection process. This metric is vital as it gives a snapshot of the efficiency and effectiveness of the recruitment process, helping HR leaders understand if their sourcing methods are working well or if they need to reassess their hiring strategies.
You can calculate yield ratio by dividing the number of successful candidates (those who have moved on to the next stage of the hiring process) by the total number of applicants for a given role.
Yield ratio = (No. of hires selected per stage ÷ Total no. of applicants) x 100
Conclusion
The work you do in human resources is crucial to your company’s success. But, without measuring and tracking important HR metrics, it is difficult to gauge the impact of your efforts or develop strategic plans for improvement.
So, if you aren’t measuring any HR metrics right now, sit down with your executive & HR teams and determine which data you need to start tracking today. If you’re already measuring some HR metrics, make sure that all of your data is helping your company reach its goals.

Also, keep in mind that the list of 20 HR metrics discussed in this article is merely a sampling of the wide range of metrics available for assessing the effectiveness of your HR function. There are numerous more that could potentially be beneficial to track and measure, depending on the specific needs of your company.
And if you haven’t gotten started yet, don’t delay any further – or you’ll risk missing out on valuable insights!
If you want to learn more about HR metrics and how to implement them in your organization, check out our HR Metrics and Workforce Analysis course. This 2-day immersive training teaches you how to use evidence-based data to align business strategy with organizational performance and achieve your business goals. Enroll today and start making a measurable impact on your organization’s success!
Have any questions? Reach out to us today at [email protected]. We’d love to hear from you!