
Business intelligence (BI) is a way for professionals to detect actionable insights in crucial data for important business decision-making. Organizations need BI tools that help them reveal a modern solution through data modelling and data analytics to generate expertly authored, comprehensible BI reports; ascertain results; and apply those outcomes to enhance their business’s overall growth.
Data scientists primarily stay occupied with data wrangling and spend most of their time in acquiring raw data, sorting it, and fixing it into a comprehensive format suitable for analysis. This is achieved by using semi-automated tools. But instead of accessing various tools and workflows, the challenge is to consolidate multiple data reports at one place and come to a single standpoint of crucial decision-making.
Microsoft Power BI helps in finishing such onerous tasks in a snap. With Microsoft Power BI, whether you are a data scientist or a novice analyst, anybody can connect to multiple data sources with this innovative tool.
Let’s check out why this new BI tool is winning the hearts of all data professionals and data-driven businesses and markets.
-
What you'll find in this article
- 1 Power BI is not just for data analysts; it’s for IT personnel as well as developers
- 2 Power BI is compatible with all Microsoft products and customized for various gadgets
- 3 Different datasets from different tools – all available at one dashboard
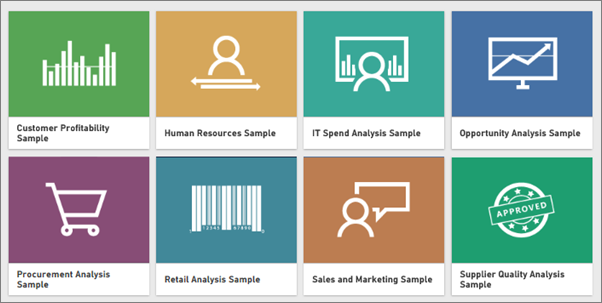
- 4 Ready-made reports available for quick access
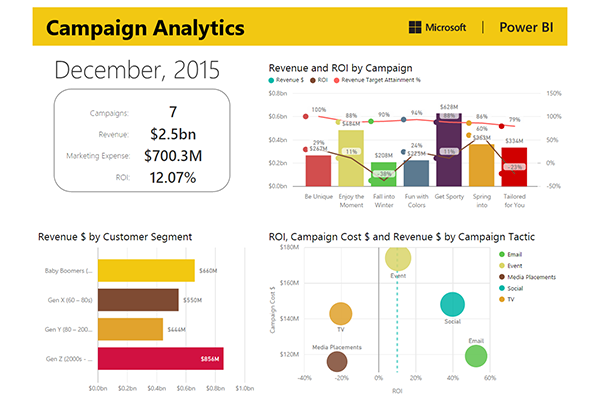
- 5 Identify factual trends and gaps to make more utilitarian decisions
- 6 Collaborate on and share customized dashboards and interactive reports
- 7 Get the full picture across different data sources for different business sectors in a jiffy
Power BI is not just for data analysts; it’s for IT personnel as well as developers
Power BI is an all-encompassing tool for any data enterprise. Keep tabs on your business data, track how data is accessed and used from a central control feature in the tool, set and track policies, detect irregularities, and take appropriate action immediately.
Developers can make use of this innovative tool to embed spectacular interactive data visuals easily in mobile applications, websites, portals, SharePoint, Microsoft Teams, and various other platforms. With this innovative tool, they can also integrate with visualization tools like R, Python, and create meaningful dashboards and reports without having to rely on multiple coding tools separately. By using Power BI REST APIs and the Power BI SDK, one can easily implant collaborative reports and dashboards, so the users can experience consistent, high-fidelity interface across all devices with Power BI.
-
Power BI is compatible with all Microsoft products and customized for various gadgets
Power BI has been configured in such a way that it can be easily used with Microsoft Excel, Office 365, Azure, and SQL Server.
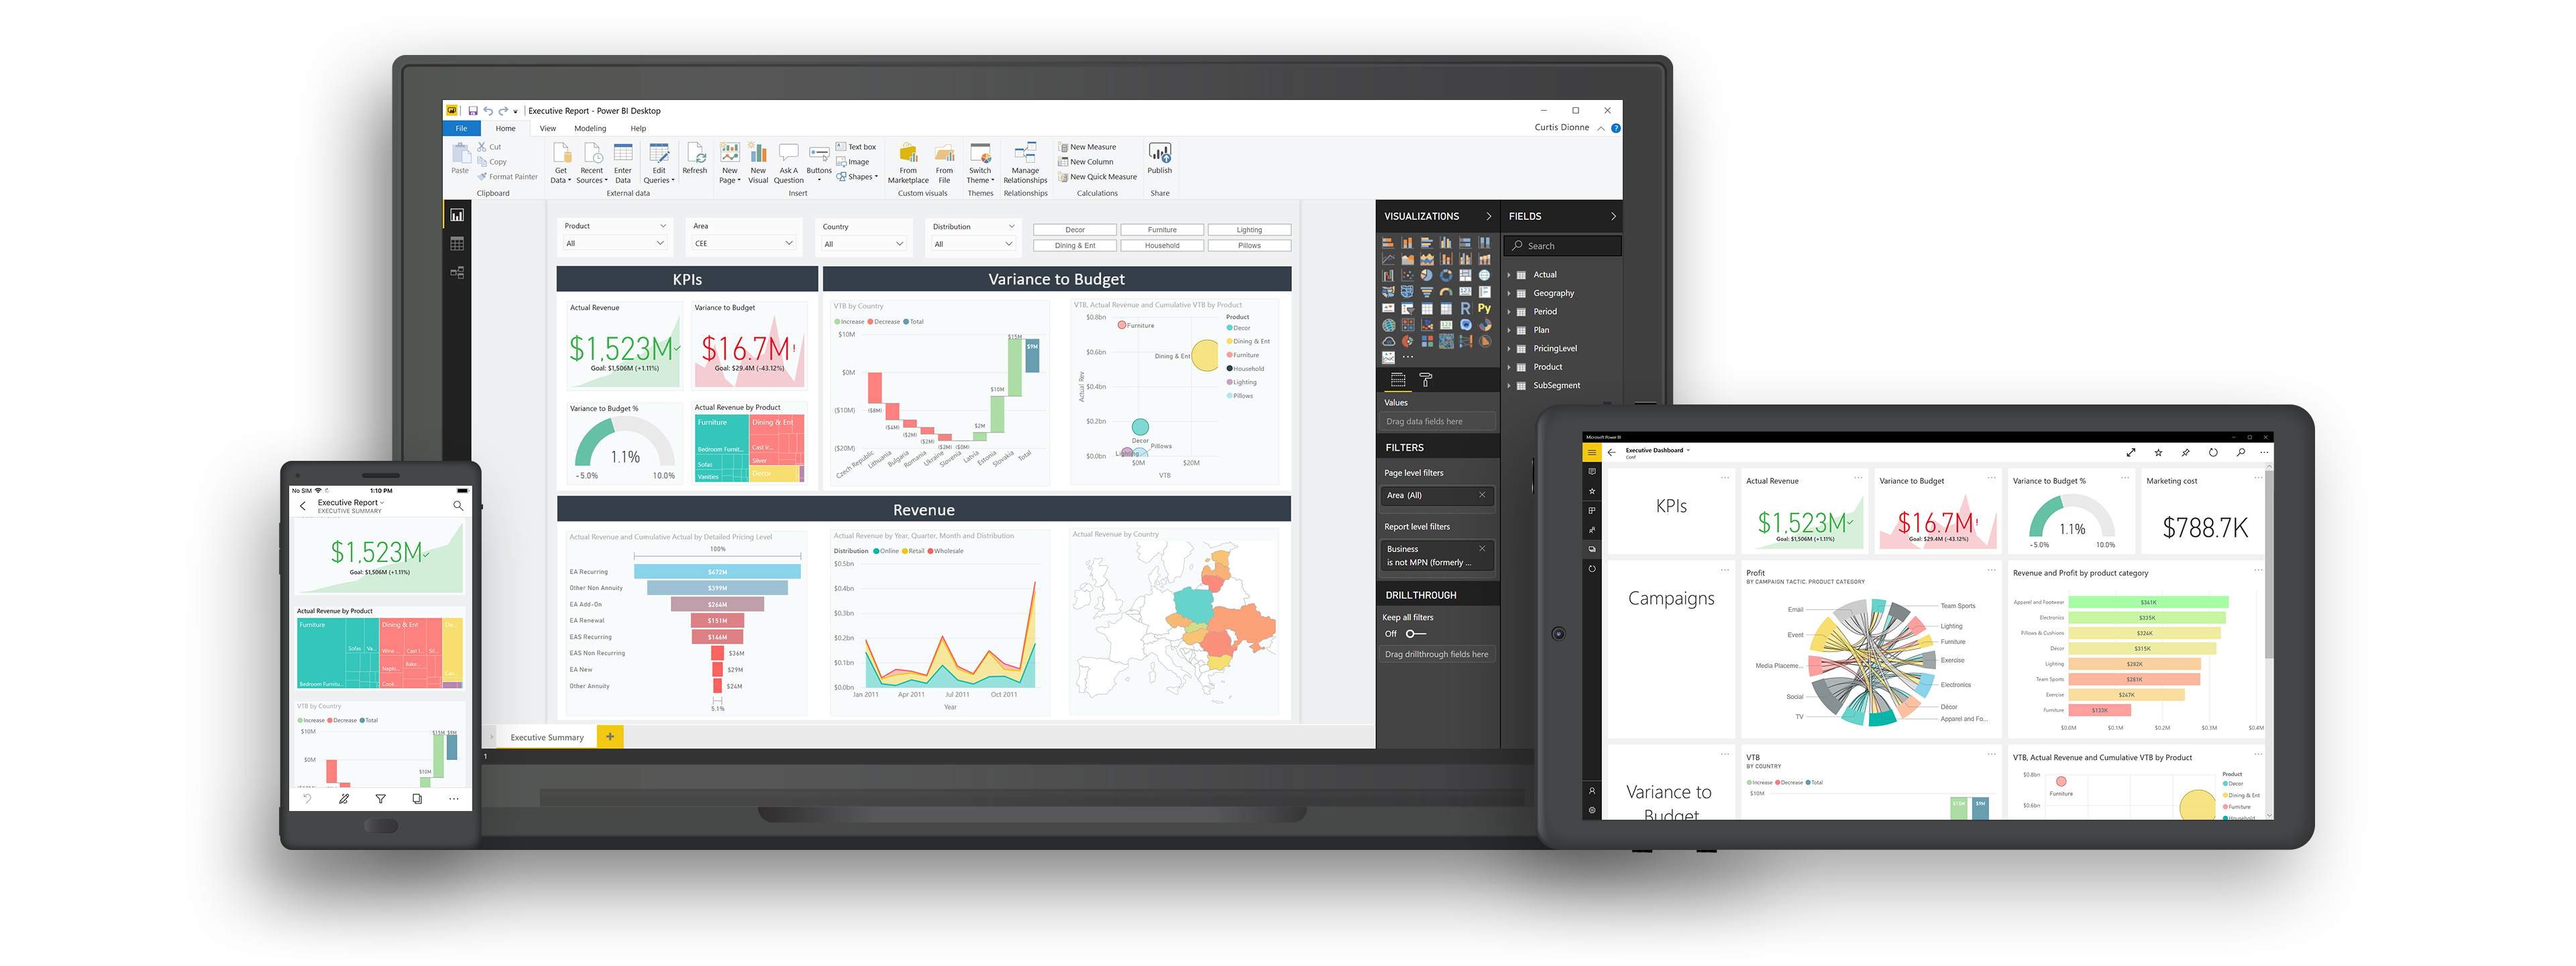
Upload MS Excel reports to Power BI and place items onto a Power BI dashboard or tag them as a data source. From Power BI desktop to Power BI Pro, Power BI Mobile, and a total of six dimensions of this tool available in the product range, business intelligence dynamics have been fully customized. At the same time, since organizations already use Microsoft products, reduce the expense on training people to use new tools by taking advantage of these familiar tools as part of your enterprise BI deployment.
-
Different datasets from different tools – all available at one dashboard
Whether your data is stored in a cloud service such as Marketo or Salesforce, or on-premises, Microsoft Power BI makes it possible for users to connect, rectify, create, model, and visualize data with live reports and dashboards from different tools and consolidate all in a single report or dataset.
-
Ready-made reports available for quick access
Get started in customized content packs, auto-made dashboards, and insightful reports with this powerful tool in no time. It takes just a few minutes to start making personalized dashboards to understand real-time insights to analyze what is really happening in the business and what decisions should be taken to improve the current set-up for better results.
-
Identify factual trends and gaps to make more utilitarian decisions
Rather than operating the commonly used BI tools like Tableau or Qlik where the data information is only limited to historical analysis, Power BI, on the other hand, lets you access actual information to spot trends early. That way, you can catch potential issues and improve the current performance of any process quicker than later. With advanced analytics incorporation of R scripts and visuals, Microsoft Azure Machine Learning, and Azure Stream Analytics, you can use your data to foresee most viable outcomes for your business, see where exactly it is significantly behind the regional trend, identify the problem, and find the best possible solution. Power BI’s predictive intelligence mechanism can help you enact proactively to progress right and go by the most reasonable path to achieve your set goals.
Discover visual data through this tool and quickly learn patterns to make better, faster decisions based on your analysis with the help of Power BI. Also, produce pixel-perfect paginated reports that your business needs to store for data studies and analysis to ascertain future risks and enact to curb them instantly. You can also confidently share your data and observations to other users because Power BI is based on a proven, enterprise-grade platform. Also, what’s great about this tool is that you can build on your on-premises reporting infrastructure, and it can be moved to be a part of a comprehensive, cloud-ready solution in the future anytime.
-
Get the full picture across different data sources for different business sectors in a jiffy
With Power BI, you can view all types of your data in a single view. Different data sets like summary statements to account-level details, financial reports, production turnaround, and data planning, Power BI tools are used by associations indulged in retail, manufacturing, insurance, airline, telecommunications, professional services, energy sector, capital markets, and public industry. Depending upon which industry your business belongs to, the amount of information generated every day should be boxed in right datasets to come up with the best industry solutions. This is where Power BI makes it easy to combine your data, find new insights, and share them with others immediately from a single platform.
So, get access to this powerful BI tool and begin to easily transform big data from disparate sources into visual BI reports in a matter of minutes!
Get quick and apt answers to crucial questions such as which factors are driving your business’s growth, where your organization is spending its resources, and accordingly, establish a way to measure KPIs across all departments for better business making. Excited for Microsoft Power BI? Learn more about how we can train you to make the most out of this new BI too!