In today’s dynamic business world, organizations rely heavily on data-driven insights to make informed decisions. Business analysts play a pivotal role in extracting value from the data obtained. But the magic doesn’t happen on its own – it requires the right tools to analyze, visualize, and streamline information effectively. As we navigate through 2024, staying ahead means knowing which business analysis tools can truly enhance your analysis and decision-making power. In this blog, we’ll explore the top 10 business analysis tools that should be on your radar this year. Let’s go!
What you'll find in this article [hide]
1. Microsoft Power BI
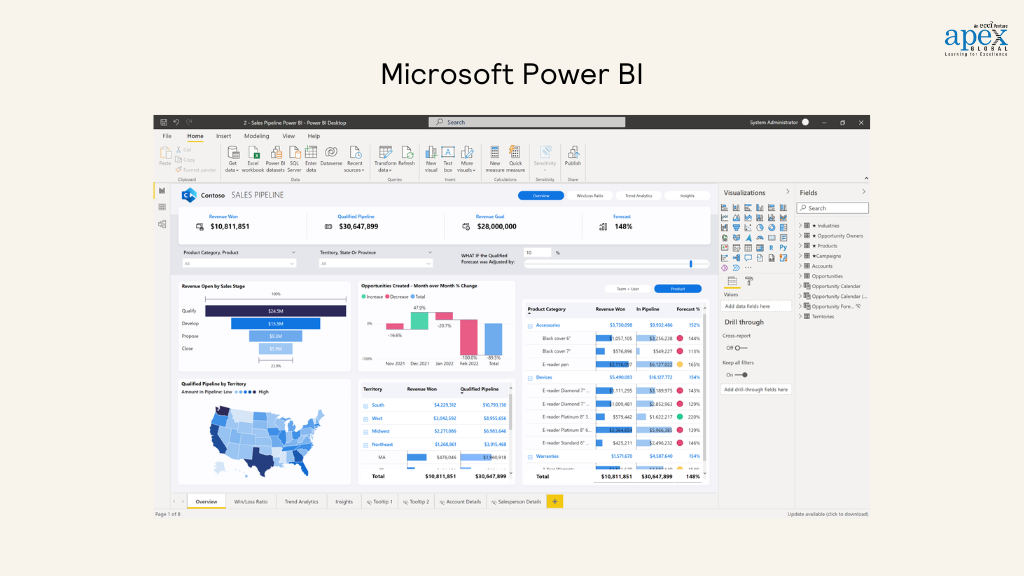
Microsoft Power BI has consistently been a top contender in the business analysis space, and 2024 is no exception. Known for its robust data visualization capabilities, Power BI allows business analysts to transform raw data into insightful reports and dashboards with just a few clicks.
Key Features:
- Offers a wide range of customizable graphs, charts and dashboards that enable users to create compelling visual representations of their data.
- Seamlessly integrates with other Microsoft products like Teams, Azure, and Excel.
- Cleans, shapes, and combines data from various sources to prepare it for analysis.
Sample Use Cases:
Retail Industry: Analyze sales data to identify trends and optimize inventory management.
Healthcare: Visualize patient data to improve care quality and operational efficiency.
2. Tableau
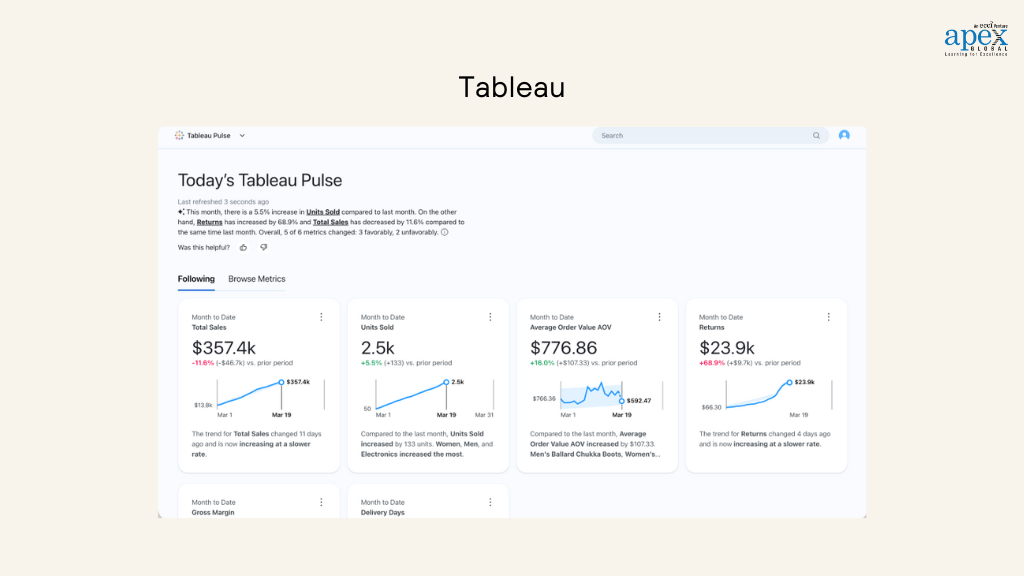
Tableau is a business analysis tool that allows you to create informative and engaging dashboards and data reports. It is intuitive and easy to use, making it ideal for companies of all sizes.
Key Features:
- Tableau’s dashboards are not just visually appealing but also highly interactive, empowering users to dive deeper into data and uncover hidden insights.
- Integrates effortlessly with a wide range of data sources, including spreadsheets, big data platforms, and cloud databases.
- Provides real-time data analysis, enabling businesses to make quick and informed decisions.
Sample Use Cases:
Marketing: Visualize customer behavior data to optimize marketing strategies.
Finance: Monitor key financial metrics in real time for better financial management.
3. Jira
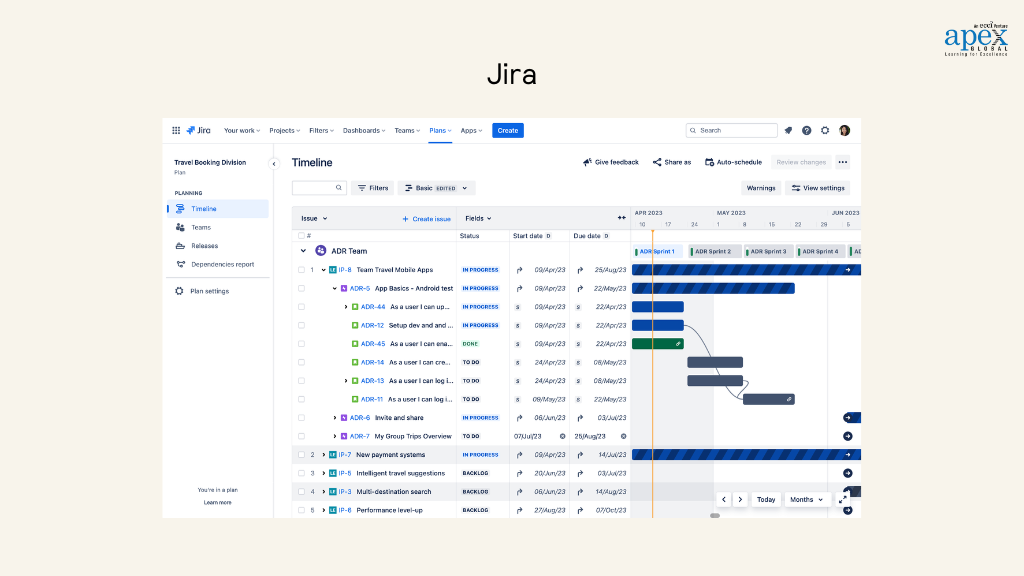
Jira, primarily known as a project management tool, offers robust business analysis features, especially in tracking and managing tasks related to software development and IT projects. From creating detailed reports to visualizing project timelines, Jira empowers business analysts to make informed decisions based on real-time data.
Key Features:
- Allows teams to track tasks and projects efficiently with customizable workflows and issue types.
- It has an intuitive interface, making it easy for beginners to navigate and utilize its full potential.
- Integrates with other Atlassian tools like Confluence and Bitbucket, as well as third-party apps.
Sample Use Cases:
Agile Development: Manage sprints and track progress in software development projects.
IT Service Management: Track and resolve IT issues and incidents efficiently.
4. Lucidchart
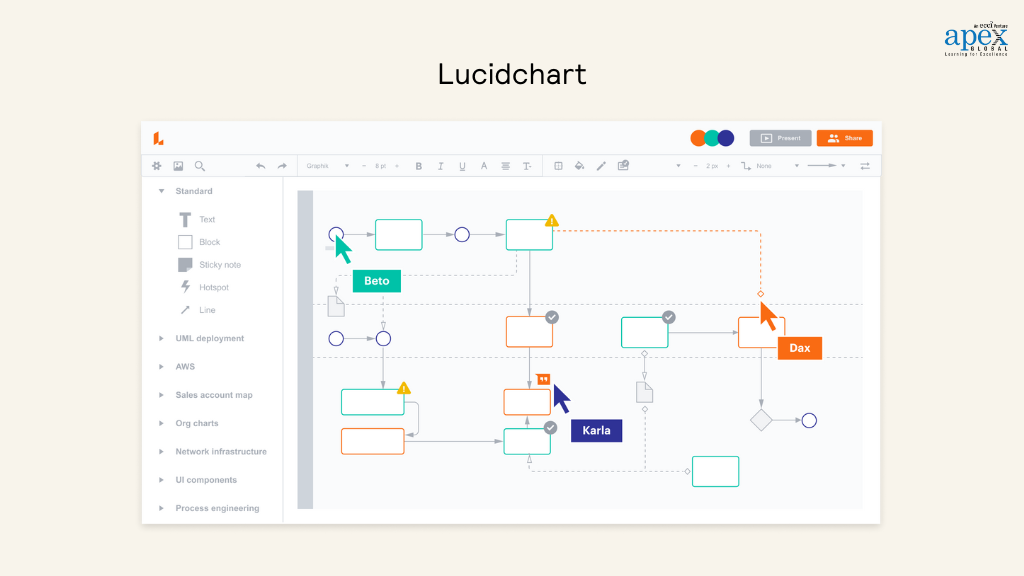
Lucidchart is a web-based diagramming tool perfect for visualizing complex systems, processes, and ideas. It’s a versatile tool that’s widely used in business analysis to create flowcharts, mind maps, and other visual representations.
Key Features:
- Easily create flowcharts, process maps, and other diagrams using an intuitive drag-and-drop interface.
- Multiple users can collaborate on a single diagram in real time, making it ideal for team-based projects.
- Integrates with popular tools like MS Office, Google Drive and Atlassian products.
Sample Use Cases:
Process Mapping: Visualize and optimize business processes for greater efficiency.
System Design: Create system architecture diagrams for IT projects.
5. Enterprise Architect
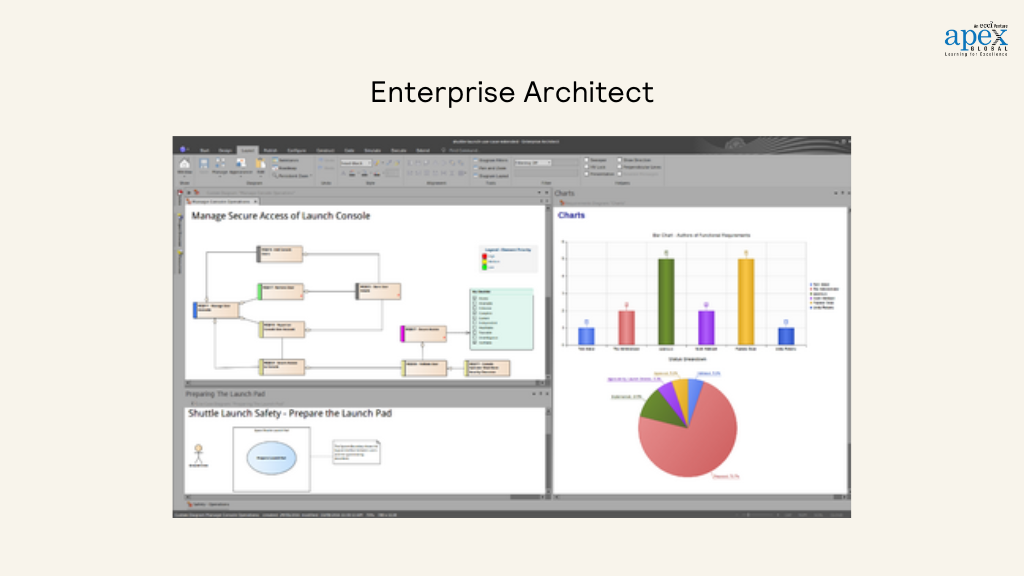
Enterprise Architect by Sparx Systems is a comprehensive modeling, design, and management tool that supports enterprise architecture, business process modeling, and software development. It’s widely used by business analysts, project managers, and systems engineers to design complex systems and manage projects efficiently.
Key Features:
- Allows business analysts to model and simulate business processes and systems accurately.
- Enables users to capture, trace, and manage requirements throughout the project lifecycle, ensuring alignment with business goals and stakeholder needs.
- Allows multiple team members to work on models simultaneously, making it ideal for large-scale projects and distributed teams.
Sample Use Cases:
Process Optimization: Identify bottlenecks, inefficiencies, and opportunities for improvement in existing processes.
System Modeling: Create UML diagrams (use case, class, sequence, etc.) to visualize system components and interactions.
6. Databox
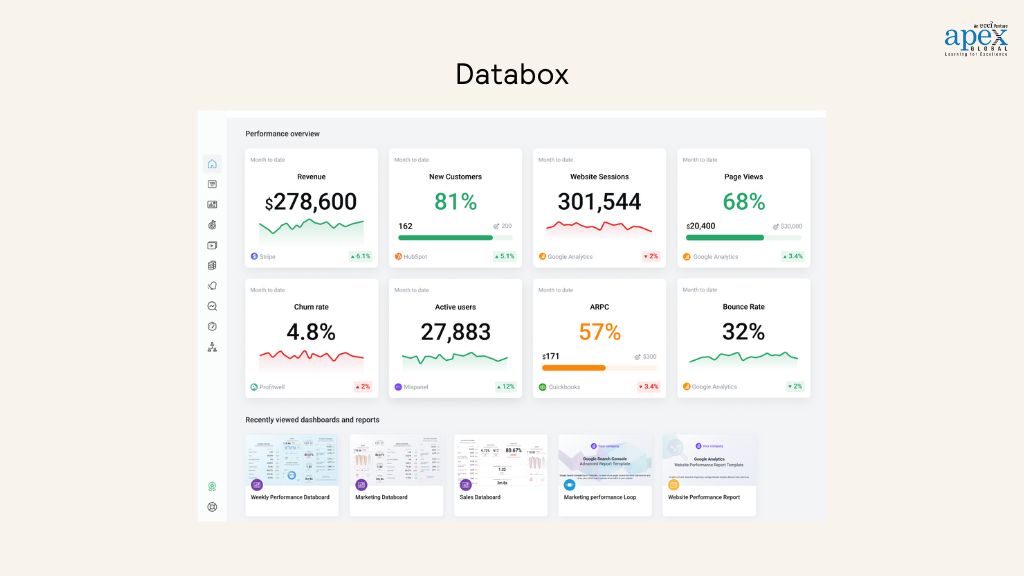
Databox is a business analysis tool that allows you to track and analyze key performance indicators (KPIs) in real-time. It’s designed for professionals who need to quickly consolidate data from multiple sources and make data-driven decisions.
Key Features:
- Enables users to create fully customizable dashboards that aggregate data from various sources.
- Supports integration with numerous data sources allowing you to analyze data across different platforms seamlessly.
- Allow analysts to set targets, monitor progress, and adjust strategies to achieve business objectives.
Sample Use Cases:
Performance Monitoring: Track company performance across different departments, helping identify areas that need improvement.
Sales and Marketing Analysis: Analyze sales and marketing data, allowing analysts to optimize campaigns and drive better results.
7. Microsoft Visio
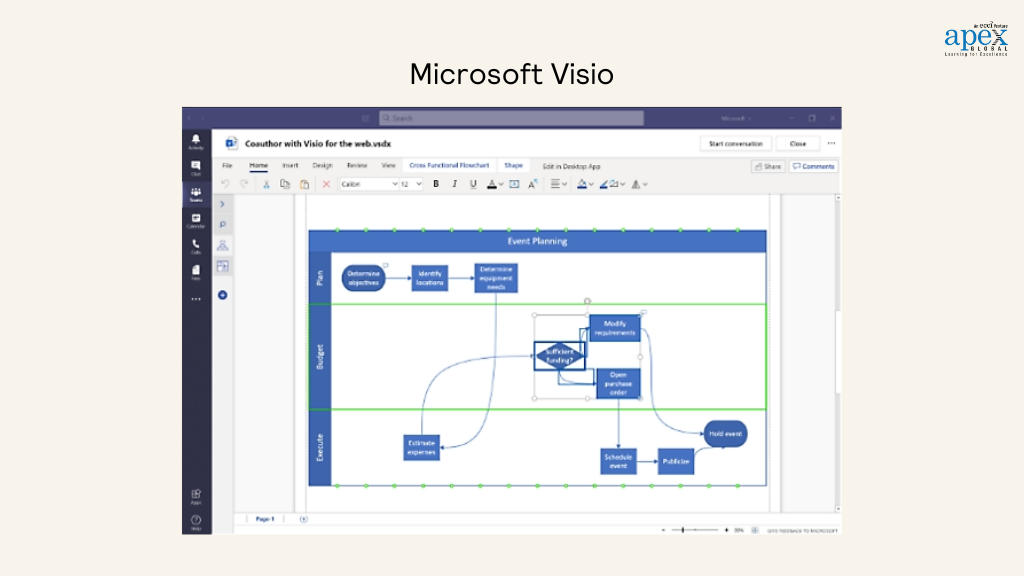
Microsoft Visio is a diagramming tool that helps users create professional diagrams, flowcharts, organizational charts, and more. It’s widely used for business analysis, particularly in visualizing processes and systems.
Key Features:
- Offers a wide range of pre-built templates and shapes that make it easy to create diagrams quickly.
- Automates the creation of diagrams based on data inputs, saving time and reducing errors.
- Integrates seamlessly with other Microsoft Office products like Excel and PowerPoint.
Sample Use Cases:
Process Documentation: Document and visualize business processes for better understanding and optimization.
System Design: Create detailed system architecture diagrams for IT projects.
8. ClickUp
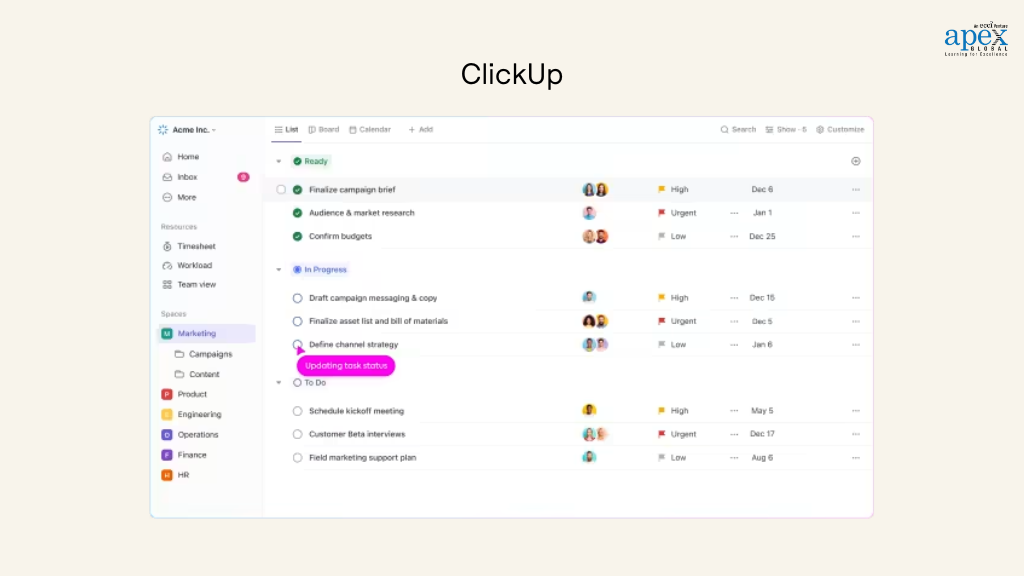
ClickUp is another project management tool that also offers robust business analysis features. It’s designed to help teams manage tasks, collaborate, and analyze project performance.
Key Features:
- Allows users to create and manage workflows that reflect their team’s processes, ensuring consistency and efficiency.
- Users can set goals and track progress, helping teams stay focused and aligned.
- Allows teams to collaborate on tasks and projects in real-time with features like comments, file sharing, and mentions.
Sample Use Cases:
Task Management: Manage and track tasks and projects across different teams and departments.
Process Improvement: Analyze project performance data to identify areas for process improvement and optimization.
9. Qlik Sense
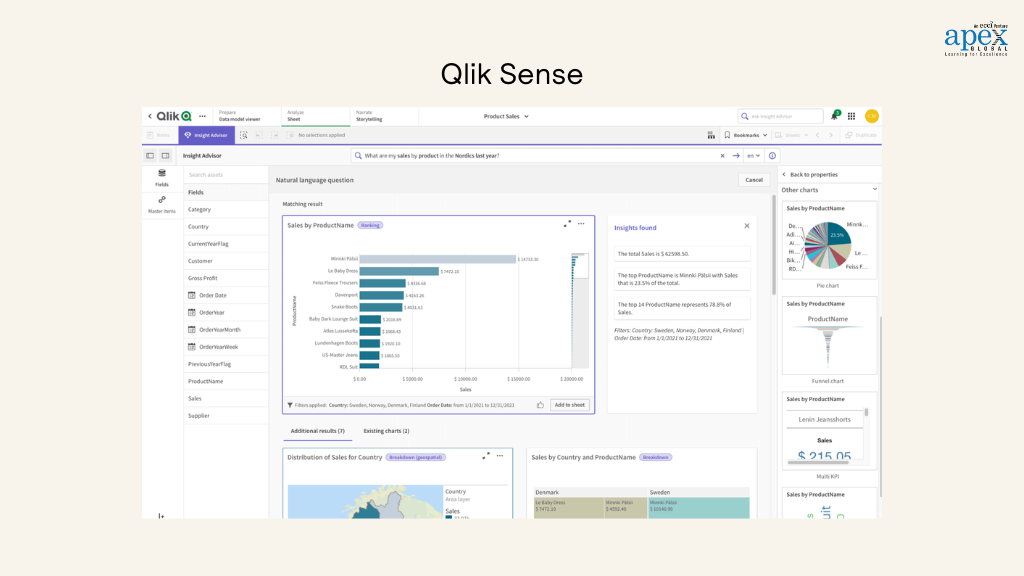
Qlik Sense is a visual data analysis tool that empowers users to make data-driven decisions. It’s known for its associative data indexing engine, which enables analysts to explore data from different perspectives easily.
Key Features:
- Unlike traditional linear data models, Qlik Sense allows users to explore relationships between data points freely, uncovering hidden insights.
- Allows users to create their own dashboards and visualizations without needing help from IT.
- Uses AI to suggest visualizations and insights based on the data being analyzed.
Sample Use Cases:
Sales Analysis: Track sales performance across regions and products to optimize sales strategies.
Financial Reporting: Create dynamic financial reports that allow for in-depth analysis and quick decision-making.
10. Sisense
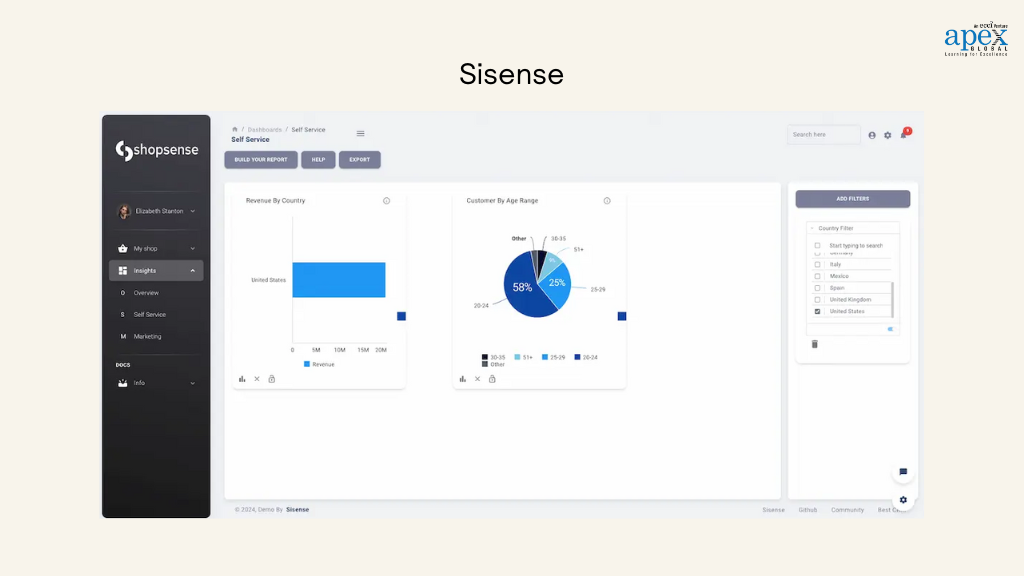
Sisense is a powerful business analysis tool that enables you to simplify complex data analysis and embed analytics into your workflows. It’s known for its ability to handle large datasets and provide deep insights, making it a valuable tool for data-driven decision-making.
Key Features:
- Optimizes data processing, enabling faster analysis and real-time insights even with large datasets.
- Allows you to create highly customizable dashboards for tailored data visualization.
- It has a user-friendly interface that makes data exploration and analysis accessible to users of all skill levels.
Sample Use Cases:
Data Consolidation and Analysis: Consolidate data from multiple sources and generate actionable insights to drive business strategy.
Operational Efficiency Analysis: Identify inefficiencies in business operations and recommend solutions to improve productivity.
Final Words
And that’s a wrap! Each of the ten business analysis tools featured in this blog offers unique features that cater to different business requirements. Choosing the right tool depends on your specific requirements, the size of your organization, and your existing technology stack. Explore these tools in more detail, take advantage of free trials, and see which ones best meet your needs.
By adopting one or more of these tools, businesses can stay competitive while also unlocking new levels of efficiency, insight, and growth. As you consider your options, remember that the right business analysis tool can be a game-changer, helping you turn data into actionable insights that can help your organization reach new heights in 2024 and beyond.
Looking to Expand Your Business Skills?
If you’re aiming to deepen your expertise and make a greater impact in your organization, consider the Certified Business Analyst Professional (CBAP) training and the Business Intelligence & Analytics Foundation course with APEX Global. These programs are designed not just for business analysts, but for anyone involved in driving business success. Whether you’re in management, project coordination, or any role that requires analytical or strategic thinking, these courses offer valuable insights and practical tools to help you excel.
With guidance from experienced instructors and curriculums tailored to real-world challenges, you’ll develop the confidence and skills needed to tackle more complex responsibilities, from comprehensive business analysis to data-driven decision-making.
It’s about growing your skills, broadening your perspective, and enhancing your ability to decide with solid data—not with mere imagination.
Have any questions? Reach out to us today via email at training@apexgloballearning.com. We’d love to hear from you!

